Sense Your City: Game of Life
I built this map a few months ago, and it seemed like a perfect way to enter the Data Canvas: Sense Your City challenge. The video below shows the map in action.
Conway's Game of Life
At first I wasn't sure how to link my map with the Sense Your City data. The data is clustered in a relatively narrow corridor of San Francisco. It's hard to visualize on a map.
Then someone suggested using Conway's Game of Life.
If you've never encountered it, Conway's Game of Life works as a model for over/underpopulation. Pixels are assigned a state - alive or dead - and each 'turn' of the game, pixels change their state depending on the surrounding pixels.
The player simply sets the game's initial conditions and lets it run.
Many starting patterns generate interesting eventual results. You can read about some of them here.

How It Works
I built a website (visible here) that pulls the most recent site-specific sound data from each sensor in San Francisco. The LED map works as an external monitor, so it just reads 96x96 pixels from the website directly.
I chose sound because it seemed the data set with the highest degree of moment-to-moment turnover. That is, one sensor could be first one moment and then last the next. Lots of variability.
Next, the site orders the moment-specific sound data from highest to lowest.
Then it assigns Conway patterns to each sensor location. Locations with the highest volume get the most 'explosive' patterns. Sites with lesser volumes get more benign patterns - patterns less likely to erupt.
Finally the simulation starts running and the eventual pattern of pixels - living, dead, or 'once living' - is impossible to predict.

Before and After
It's important to note that small variations in the initial conditions can cause enormous variations in the eventual state of the city.
I think this is an extremely valuable lesson.
There are so many environmental factors to keep track of - how they affect a city as a whole is entirely unpredictable. Chaotic.
So what happens when you change the conditions of one element in a chaotic urban system?
This installation is a visual answer to that question. It illustrates the complexity of urban development, and the ways in which 'meaning' can fluctuate with initial conditions.
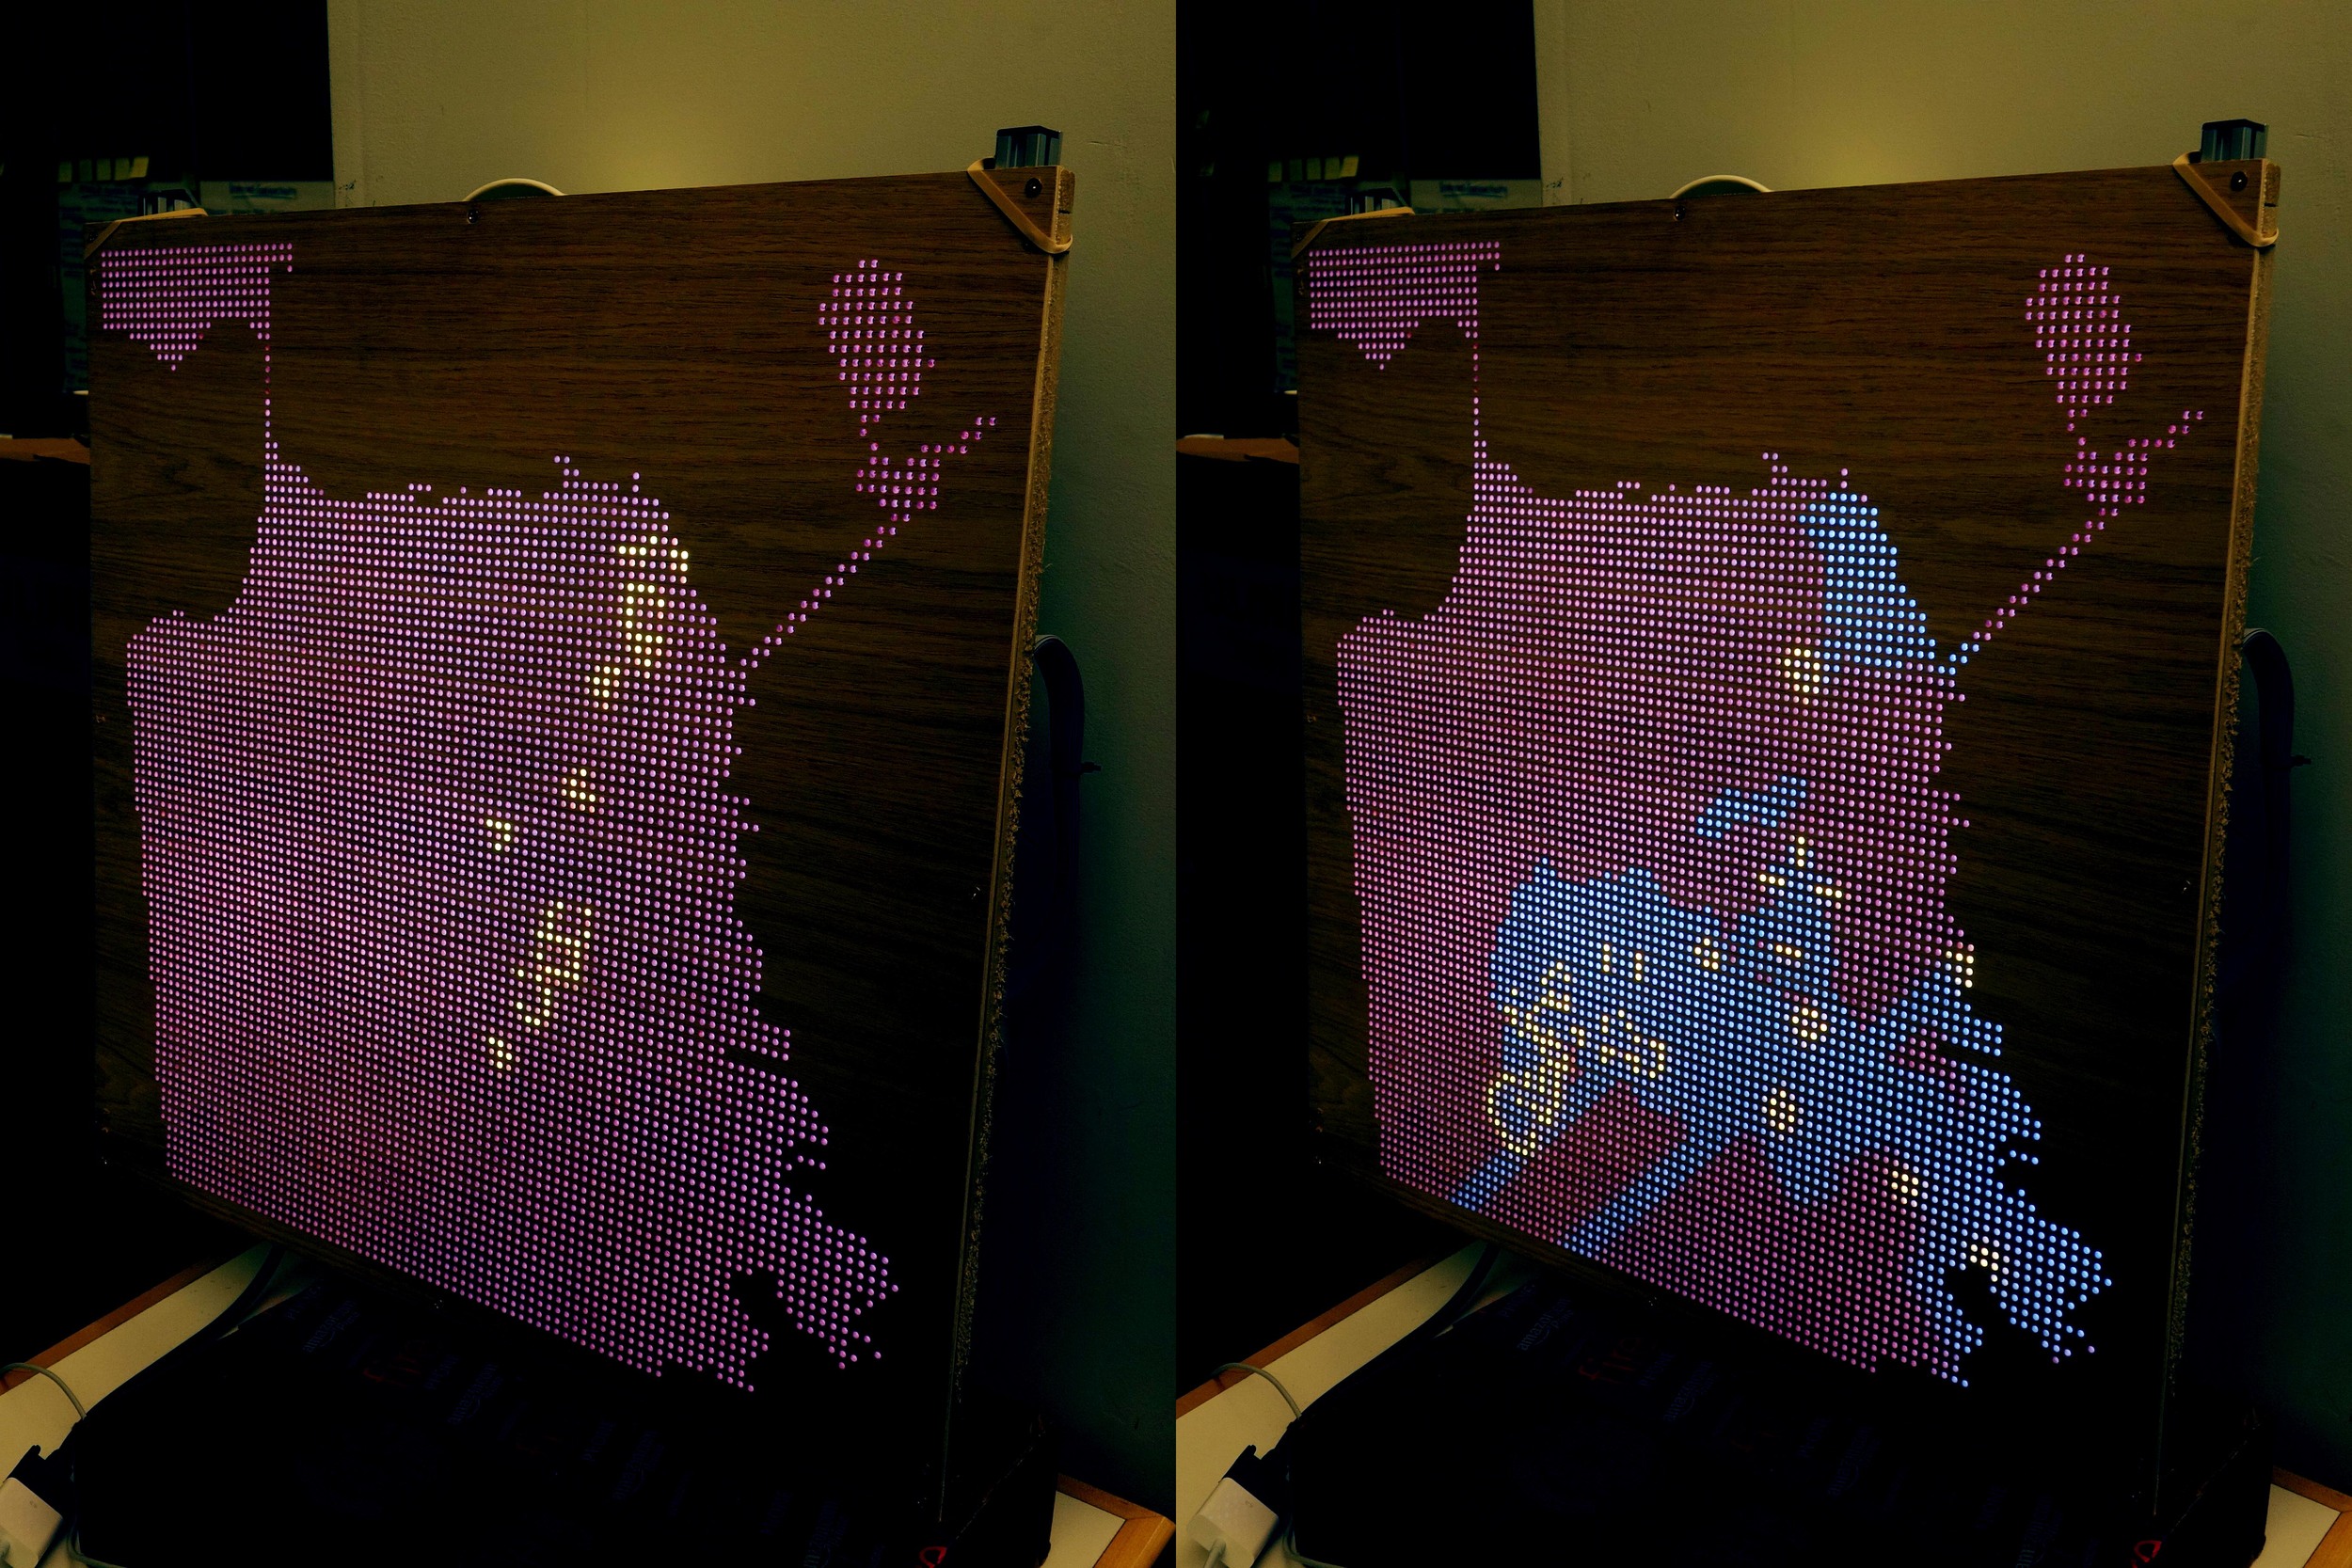
*Each one of the examples below shows a set of initial game conditions generated by Sense Your City data, as well as the eventual pattern of results 200 turns into the game.*

Initial conditions based on Sense Your City data -> Results 200 turns into the game.
Initial conditions based on Sense Your City data -> Results 200 turns into the game.

Initial conditions based on Sense Your City data -> Results 200 turns into the game.

Initial conditions based on Sense Your City data -> Results 200 turns into the game.

Initial conditions based on Sense Your City data -> Results 200 turns into the game.

Initial conditions based on Sense Your City data -> Results 200 turns into the game.